

Monitoring built to last. Without the dead weight.

It warns you once an outage is confirmed, says why in one sentence, and updates without the cold sweat. Free, open source, on your servers.

  • Free software, AGPL-3.0
  • No per-host license
  • No inbound port to open
A host's page in CRITICAL: the alert “Inbound saturation: eth0 at 93%, above 90% for 5 min”, the curve that crossed the threshold, and the age of each probe's last result. A host's page in CRITICAL: the alert “Inbound saturation: eth0 at 93%, above 90% for 5 min”, the curve that crossed the threshold, and the age of each probe's last result.

Your monitoring costs more than the peace of mind it gives you.

From one team to the next, the symptoms are the same.

  • Your users notice before your monitoring does.

    The dashboard is green, the outage is real: the light showed the last known state, not a recent check.

  • So many alerts that nobody reads them.

    A hundred messages for one outage, in the middle of the night, and the one that mattered drowned in the noise.

  • Only one person knows how to run it.

    Files, templates, threshold syntax: the day that person is away, nothing moves.

  • Every remote site is one more risk.

    An inbound rule to open, a VPN to negotiate, and one more license for every host you add.

What banshee changes.

A central server, the master, and relays installed close to your equipment, the pollers, which call it themselves. On that basis, four commitments, each with its proof.

It tells the truth. You know before your users do.

In banshee, a green light means “checked recently”, and the screen says when. Never “last known state”.

  • Every check, a “probe” in banshee, shows the age of its last result. A result that is not renewed in time is marked stale, never left green.
  • Every relay sends a heartbeat each minute. If it goes silent, its checks stop being green at once: a site that has gone quiet shows.
  • A check that cannot measure does not pass itself off as green: it says whether its configuration is at fault or the device is not answering.
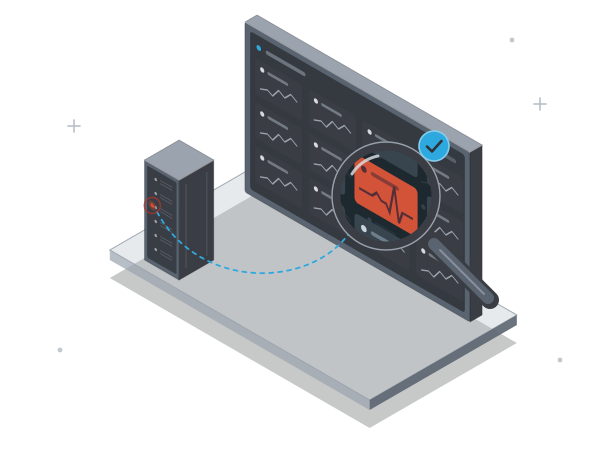
A dashboard of twelve tiles, only one of them red; a magnifier points at it, and a line links it to the server that is really down.
When a tile turns red, a check has really failed.

It stays quiet when all is well. Calm on-call nights. Alerts people actually read.

banshee only disturbs you when something changes, and every alert says why, in one sentence.

  • An alert reads at a glance: “eth0 at 93%, above 90% for 5 min”.
  • A problem only raises an alert once confirmed, after the time or the number of failures you choose.
  • During an alert storm, messages are grouped into one, at the pace you set, and none is lost: those waiting go out with the next message.

A banshee that wails for nothing ends up unheard.

One poller · 48 probes · one heartbeat a minute 12:04

48 probes at 1: all is well, nothing to report.

Illustration, fictitious data

When all is well, a poller only sends one heartbeat a minute, one bit per probe. The moment a probe drops, the details go out at once.

It takes no experts. Your whole team can run it, not just one person.

Everything is set on screen: tick what you want to watch, adjust a threshold if you wish, and that's it.

  • Use cases named in plain words, “Link down”, “Inbound saturation”, are simply ticked; every threshold is optional, and a threshold left blank simply triggers nothing.
  • A probe comes ready to use from a repository, the community's or your own; for a need of your own, it is written like a short script, reviewed before it is deployed.
  • Every version of a probe is kept: what ran yesterday can be compared and restored in one click.
  • A setting placed on a folder applies to everything in it, and the screen shows where each value comes from: change it once, for a whole branch.
The Inventory: the tree of folders, hosts and their probes, and an open host where every setting shows whether it is inherited from a folder, set here, or a default. The Inventory: the tree of folders, hosts and their probes, and an open host where every setting shows whether it is inherited from a folder, set here, or a default.
The page of a network interfaces probe on web-01.paris.example: “Only eth0, bond0”, then the use cases on offer, nine of them ticked, each with thresholds to fill in or leave empty. The page of a network interfaces probe on web-01.paris.example: “Only eth0, bond0”, then the use cases on offer, nine of them ticked, each with thresholds to fill in or leave empty.
On a probe, tick what matters and leave blank what doesn't; in the Inventory, see where each setting comes from.

It doesn't expose you. Less risk, no lock-in.

Monitoring a remote site takes no VPN and no inbound rule, and one compromised machine is not enough to turn the tool against you.

  • Pollers call the master, never the other way round: no inbound port on the sites you monitor.
  • A compromised master does not take over the pollers: an update of their probes is read and confirmed on the poller, by an administrator.
  • banshee is built to read your equipment, not to change it; what a probe sends to a device is written plainly in its code, which you review before deploying it.
  • Installed on your servers, under a free license: your data and your monitoring stay yours.
Pollers call the master Three pollers, in a datacenter, at a customer's site and on a server, each open an outbound connection to the master through the firewall. Under each poller, the equipment it queries. master configuration · screens firewall · NAT outbound only poller datacenter poller at a customer poller on the monitored server switch · SNMP BMC · HTTPS Windows · WMI Linux · SSH router · SNMP API · HTTPS disks services
Pollers reach out to the master. Nothing comes into the monitored sites.

Under the hood.

  • Maintenance cut to the bare minimum.

    Fewer moving parts mean fewer outages and fewer updates to track. The master and the poller are each a single Go executable, with no Python, Perl or Java to install alongside. Updating means replacing the file and restarting the service, under systemd or Windows, with DEB, RPM, BSD and macOS packages.

  • Probes the whole team can read.

    Your monitoring no longer depends on whoever wrote the scripts. Every probe is written in Keen, one simple language built into banshee and checked before it is deployed, instead of Bash, Python and Perl scripts scattered across machines. Read one and you can read them all.

  • One tool for your servers, your network and your cloud.

    Local machines, remote sites and online services are watched the same way, without opening anything in your firewall. The poller can watch the machine that hosts it, relay to a subnet over SNMP, SSH or HTTPS, and query your cloud services through their APIs: AWS, Azure, Microsoft 365. It is the poller that connects to the master: no inbound port to open.

  • Monitoring that keeps up with your estate, no re-keying.

    A machine can be monitored from the moment it is created, without waiting for someone to remember to add it. If you work the GitOps or DevOps way, a VM created by Terraform, a server provisioned by Ansible or a service shipped by GitLab CI can join banshee with its probes, through the public API, in the same pipeline. If not, the web interface does the job just as well.

A probe reads like a recipe.

Anyone on the team can read a probe, without depending on the person who wrote it. This one checks that a site answers 200 and measures its response time.

Keen is built into banshee: no interpreter, no library, no module to install or keep up to date on your servers. Every probe is checked before it is deployed and reads only what it declares.

// The standard settings of the HTTP protocol.
need('protocol:http');

output('code', 'number', array('label' => 'Response code'));
output('response-time', 'number', array('label' => 'Response time', 'unit' => 'ms'));

// Critical unless 200. Slow: warning at 500 ms, critical at 2 s, three runs in a row.
watch.expect('code', 'Wrong response', 'code', array('critical' => array(200)));
watch.above('slow', 'Slow site', 'response-time',
    array('warning' => 500, 'critical' => 2000, 'for' => '3 runs'));

// Ask the site for its page, then return what was measured.
$answer = http.get('https://www.example/');
value('code', $answer['status']);
value('response-time', $answer['time']);
A whole probe: what it needs, what it returns, what makes it alert, then the request.

Built for 80,000 hosts and 600,000 probes.

A deliberately oversized target that keeps the architecture light: what carries 80,000 hosts runs effortlessly on fifty, and your estate can grow without changing tools.

Tested with 650,000 folders, hosts and probes.

Free, open source software.

Under the AGPL-3.0 license, with no fee per host or per probe. You install it on your own servers, and the license gives you the right to read its code and adapt it.

The AGPL protects that openness: anyone who modifies banshee and makes it available to other users over a network must give them its code.

Sponsors

Two companies support the project.

Become a sponsor

Latest posts

See all posts
  • Community: monitoring is meant to be shared

    Why I wanted a public repository of collectors from the start, what it changes day to day, and why I think a probe should be shared like a Docker image rather than sold in a pack.

  • Hello World: meet banshee

    banshee is free, open source monitoring, designed to tell the truth on the day everything goes wrong. What it is, what sets it apart, and where the project stands: a central server well along, and the poller as the next step.

Want to try it on your infrastructure?

Describe your infrastructure or ask your question: the team that builds banshee replies to the email address you give.