Monitoring has given us a lot. It has also taken a lot of our time.

Here is what we owe to the tools that came before us, what we do differently, and what we refuse.

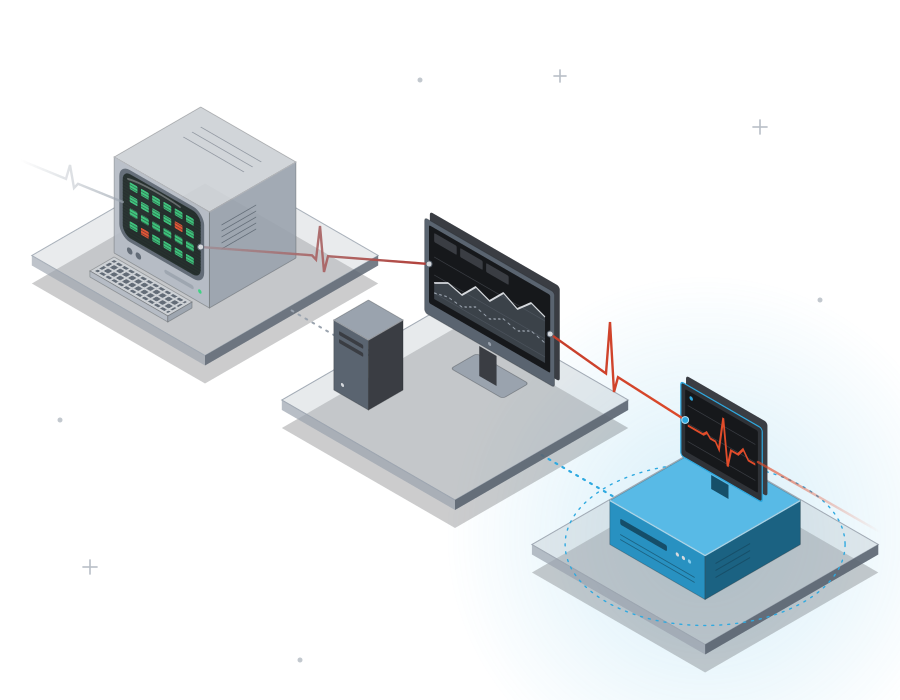
The lineage of monitoring: an old console, then a modern dashboard, then banshee, joined by one heartbeat.

What classic monitoring taught us.

We have nothing against it: we worked with it for a long time, and banshee owes it a great deal.

  • SiteScope

    Monitoring in the browser.

    One of the first monitoring tools to be configured entirely from the browser, with no agent to install on the monitored machines.

    In banshee too, everything is set on screen.

  • Nagios

    The right concept.

    A simple idea that has not aged a day: check at regular intervals that every service answers, and warn when it stops. Its states, OK, WARNING and CRITICAL, became the common language of the trade.

    banshee keeps those three words.

  • Zabbix

    Monitoring, well equipped.

    Configuration on screen, templates applied to whole families of machines, an agent, and automatic discovery of what there is to monitor.

    In banshee, a setting placed on a folder applies to everything it contains.

  • PRTG

    Ready to use.

    Ready-made sensors, each devoted to one measurement, and a quick start.

    A banshee probe, too, comes ready to use from a repository.

  • Centreon France

    Monitoring on screen.

    It modernized that legacy: a web interface to configure and consult, and collection engines installed close to the equipment, the pollers.

    We borrow the word. In banshee, the poller always calls the central server, never the other way around.

  • Checkmk

    Automatic discovery.

    Built on a Nagios base, it made the discovery of the services to monitor on each machine automatic.

    In banshee, each collector proposes its watches: you tick them instead of declaring everything.

  • Icinga

    The legacy, taken up.

    Born from Nagios, it took up its legacy and moved it forward, to open its development to a wider community.

    We chose to start from a blank page.

  • Prometheus, Grafana and the like

    Data, side by side.

    Real tools, of a different kind, built on metrics: measurement at scale and a language to query it, graphs, and information brought together from everywhere. They excel at answering “what happened?”

    banshee starts from another question: “do we need to act, now?”

  • Datadog

    Observability as a service.

    A very complete hosted platform: metrics, logs, traces, dashboards and hundreds of integrations. It is billed per host and by data volume, and the data lives with the vendor.

    banshee installs on your own servers, with no per-host license.

  • Uptime Kuma

    Simplicity, rediscovered.

    Along with the tools of its kind, it showed that a monitoring tool can be simple to install and pleasant to use. They do what they do well, within a narrow scope: knowing whether a site or a service answers.

    We want that simplicity for a whole estate: servers, network, hardware, applications.

We are not starting from scratch. We are starting from there.

What it costs today.

Monitoring has become complicated. It eats an enormous amount of time.

  • The probes of classic monitoring, the small programs that each run one check, are written in Perl, Python, shell or C, depending on their author.
  • Each has its own options, its own way of returning a result and setting its thresholds: no two are quite alike.
  • They change from one update to the next: an option renamed, an output that changes shape, and a check that no longer says quite the same thing.
  • Running them takes rare knowledge, often held by a single person.

That is where the project comes from: too many hours lost, and knowledge too specialized for a task that should be ordinary.

Monitoring rethought to be simpler.

Not one more layer on top of what exists, but a tool rethought from the check to the alert.

What banshee does

  • The code of a probe, its collector, is written in a single language, Keen, banshee’s own, and always in the same shape: read the equipment, compute, return values, propose watches. Read one and you can read them all.
  • What a collector does on a piece of equipment is written plainly in its code, and reviewed before it is deployed.
  • You tick what you want to watch; thresholds are optional.
  • Every version of a collector is kept: it can be compared, and restored in one click.
  • A green light means “checked recently,” never “last known state.”

What we are building

  • We want any technician to be able to add their own probes after a few hours at most spent discovering banshee.
  • We want banshee to connect with the other tools in your IT environment: a measure of openness and flexibility, rather than a closed world.

What we stand for.

  • Free software.

    banshee is licensed under the AGPL-3.0: its code can be read and adapted, and it stays open, since anyone who modifies it and makes it available to other users over a network must give them the code.

  • No lock-in.

    Vendor lock-in is the day your data and your checks can no longer leave the vendor. banshee runs on your own servers, your data stays there, and every collector is code you can read.

  • No freemium.

    Freemium is the restricted free version that pushes you toward a paid edition. banshee has only one edition, the same for everyone, with no per-host or per-probe license.

Grow banshee with us.

Sponsor the project

A sponsor funds the time spent building banshee, and its name appears on this site. Two companies already do.

Become a partner

We want to build a network of partners who specialize in deploying and developing on banshee, so that companies can count on guarantees and support when they roll it out. The software stays free and the same for everyone: what a partner brings is their support.

Irish legends, an Alsatian product.

Two names drawn from the same Irish legend: the one who warns, and her song.

banshee

In Irish legend, the bean sí, the banshee, wails before misfortune strikes the house. She causes nothing: she sees it coming, and she warns. It is the ideal job description for a monitoring tool.

banshee watches over servers, networks and applications, and only cries out when it matters. No wall of green lights to stare at, no hundred alerts for a single outage: one voice, at the right moment, saying what is happening and why. The rest of the time, it stays quiet. A banshee that wails for nothing ends up no longer being heard.

Keen

Keen comes from the Irish caoineadh: the lament, the mourning song the banshee raises in the night. It is the language of the collectors.

It is one simple language for every collector, shipped with banshee and with no dependency on the system. Its shape is familiar to any administrator who has ever written a script on an on-call night: read the target, compute, return values, propose watches, one line each. Keen is made for reading: what a collector does on a target is written in black and white in its code, reviewed before it is deployed. Its only lament: a full disk.

Alsace

Made in Elsass

We design and write banshee in Alsace.